added
Aggregated performance data graph
almost 4 years ago by Anja Alempijevic
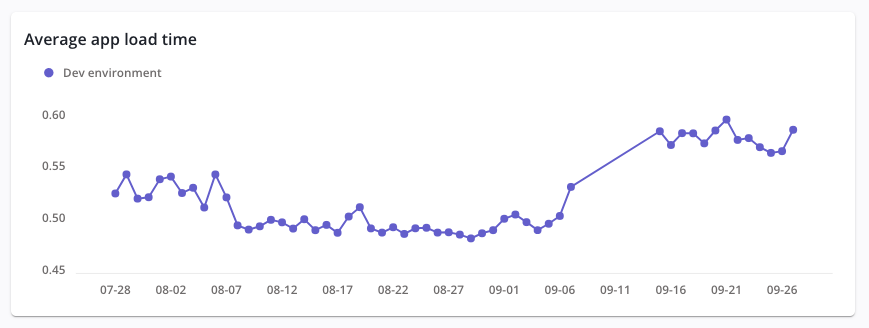
Ever want to use your existing mabl tests to learn more about your app's performance? Now you can from the release coverage page. In any trial or enterprise workspace, mabl will automatically populate the "Average app load time" chart for each day from Chrome traces collected from your passing Chrome runs in the cloud. Learn more about release coverage in our docs.

App load time across a development environment, with a worsening performance trend visible on the right.
Pro tip: use the filters at the top of the page to look at performance in a specific environment or for a specific set of tests that cover a key feature or product area.