Coverage reports
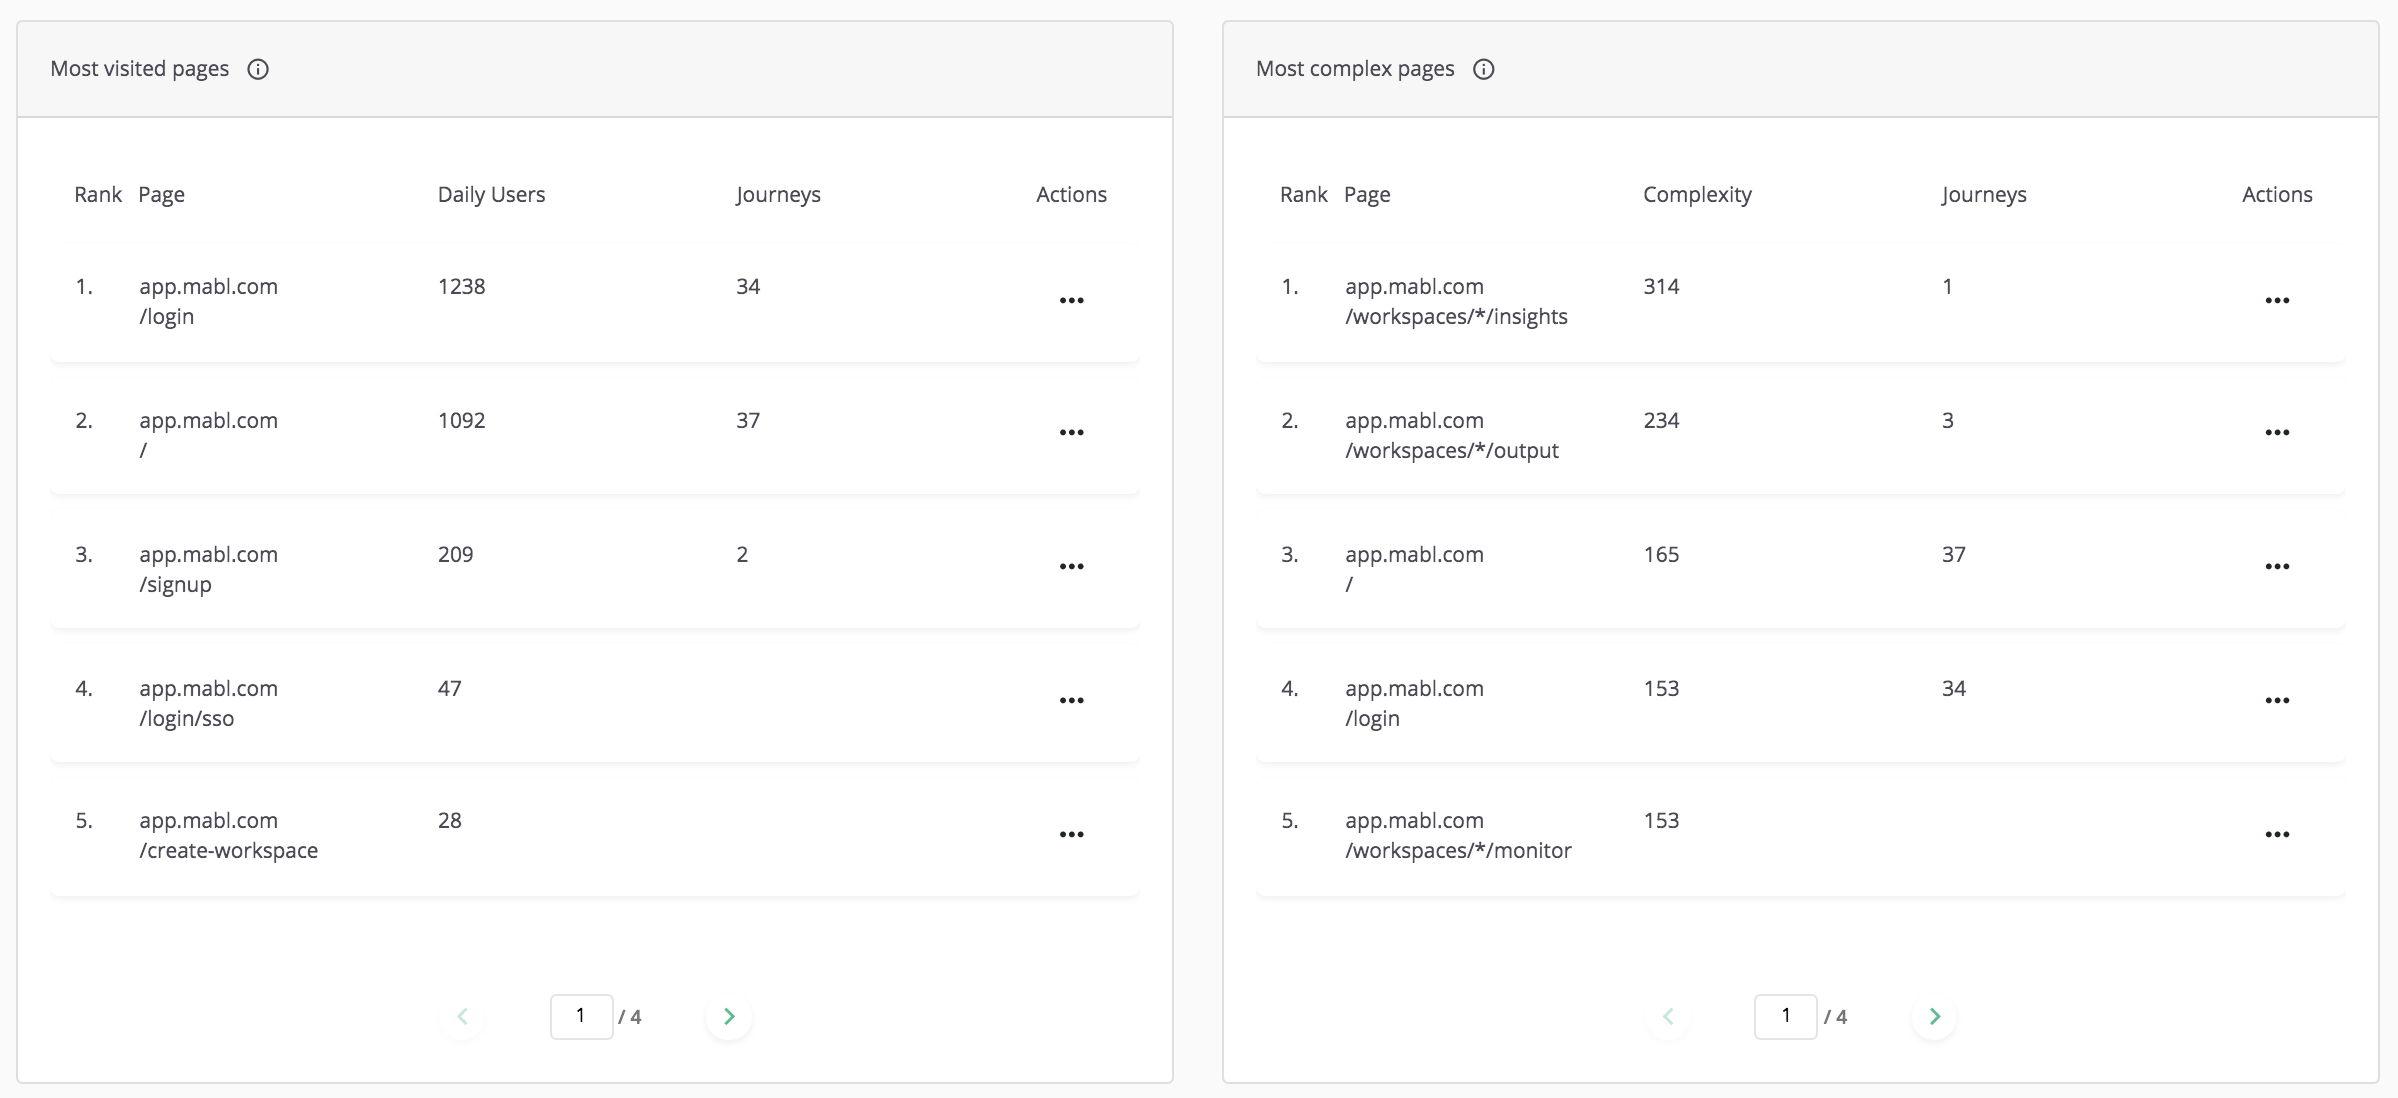
Coverage reports are now available on the coverage page under "Page reports". It's easier to see which pages have the most users and complexity and how much coverage they have (or lack), compared to the number of journeys covering each page. This may better inform which pages need the most attention from a testing perspective.
Most workspaces will have a "Most complex pages" report, which is the number of typically interactive elements on the page, such as buttons, links, and fields. This report is sorted by the most complex pages, showing the top 50.
If a workspace has the Segment integration turned on (Segment can be turned on from the top of the coverage page), that workspace will also have a "Most visited pages" report, which is the average number of unique users visiting the page per day. This report is sorted by the most visited pages, showing the top 50.
For both reports, the number of journeys and actions per page (like view screenshot, create journey) are also available.
