View and export app load time of an individual test run
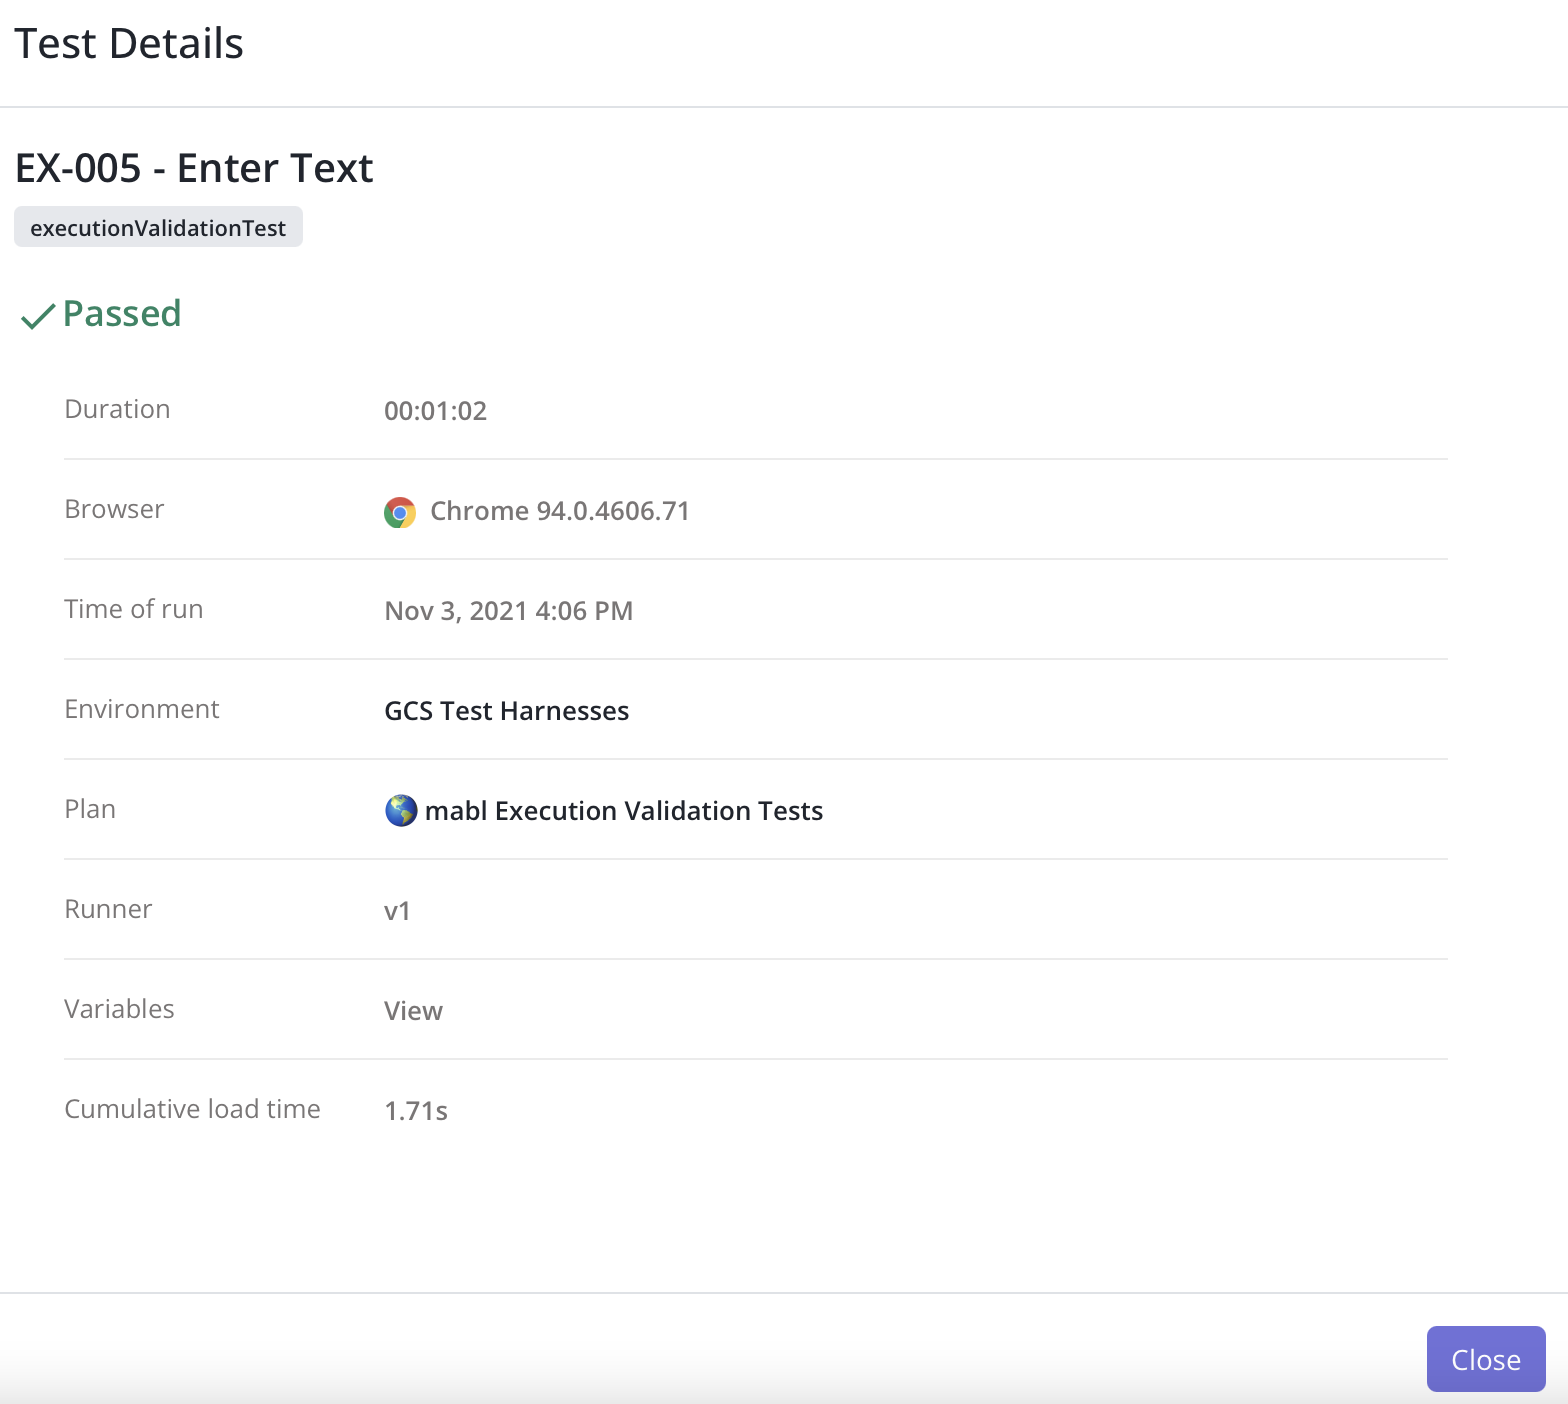
You can now access the total time your app took to load during a single test run as measured automatically by mabl. This can now be found by clicking "View all" at the top of any test output and looking for "Cumulative load time," in addition to the cumulative data available from the Performance tab of any test as well as the new Release Coverage page. As a reminder, this metric is what users would perceive as your app's overall load time for an entire test run. The feature is available for all enterprise and trial accounts, and is populated by Chrome tests run as part of a plan in the cloud.

The Test Details modal now holds the test's cumulative load time information.
It is also a part of a .csv document that you can export from the Results page for a group of tests, making it simple to conduct further analysis.

Document and easily compare cumulative load times between test runs.