
Understanding coverage by page
The page coverage dashboard measures mabl test coverage of your application. To view a breakdown of coverage by page, scroll down to the Application pages table. This article explains how to interpret the Application pages table and how to filter data to get a better understanding of your mabl test coverage.
The Application pages table
For each page listed in the Application pages table, mabl shows the screenshot from the most recent link crawler run and more detailed metrics on the tests that cover this page.
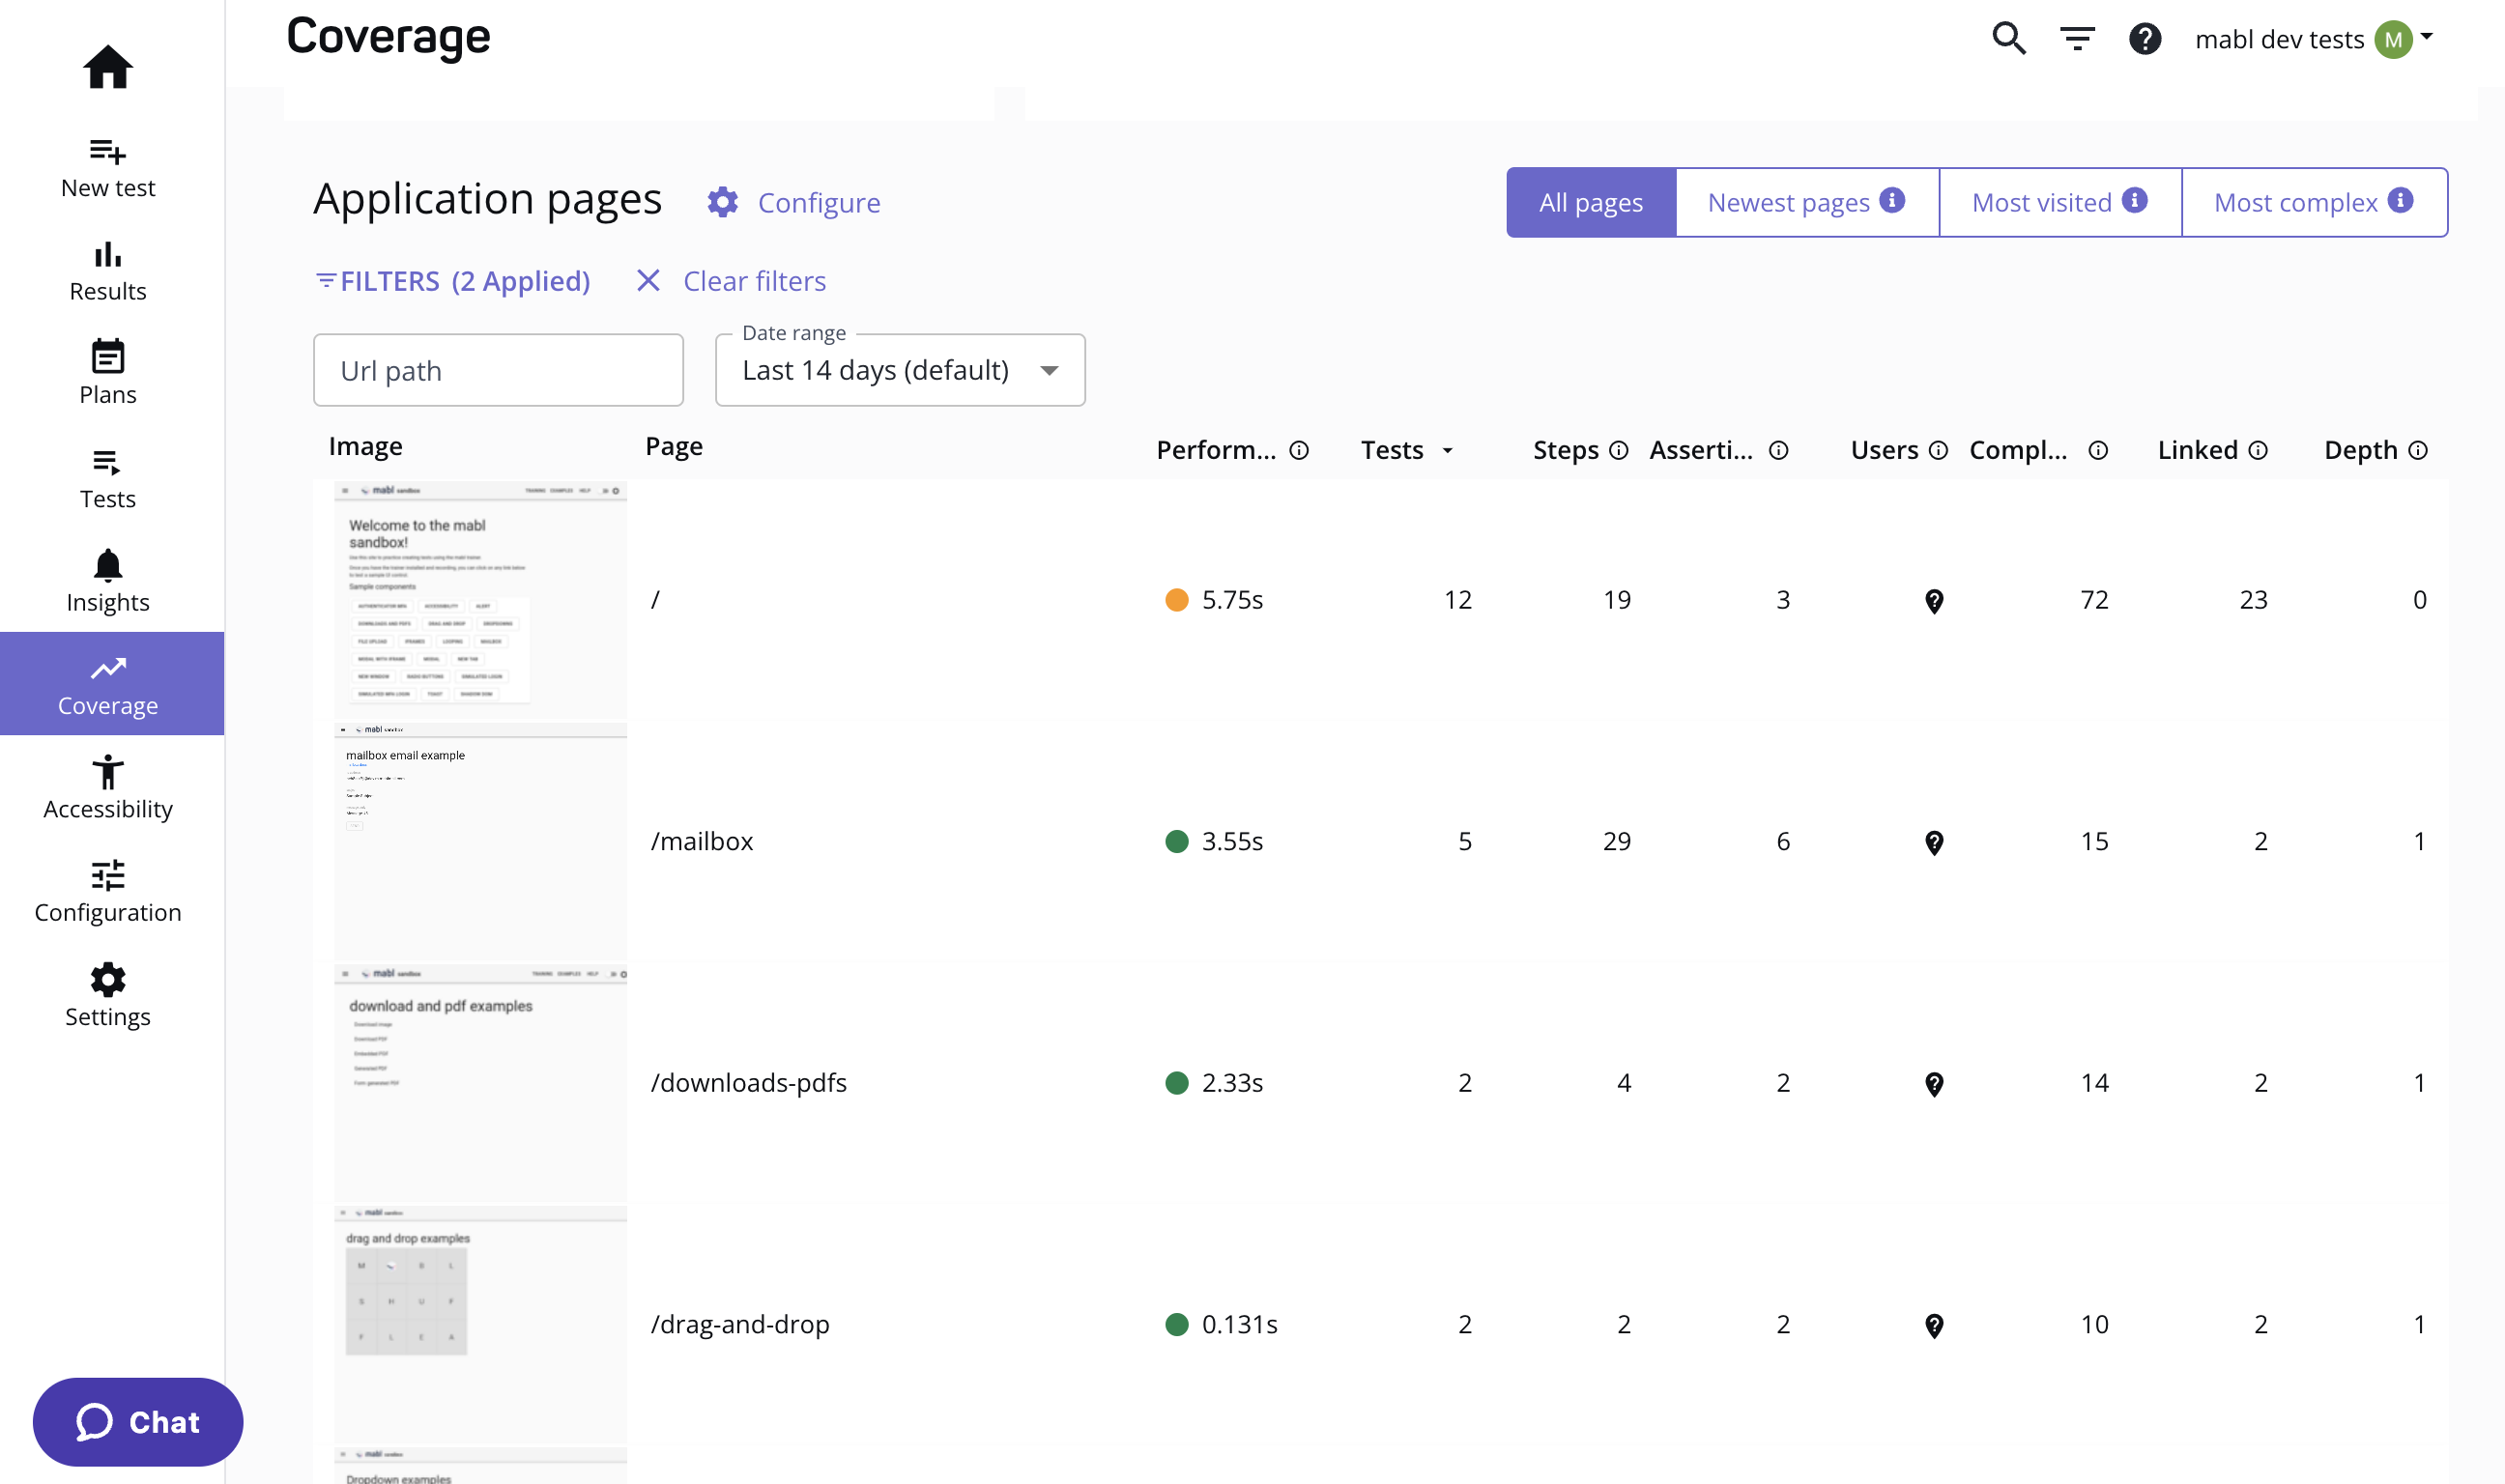
The Application pages table
By default, mabl reports page coverage metrics for the last two weeks. If a test or test step visits a specific page but never runs in the cloud due to an upstream test failure or conditional logic, it is not included in these totals. If you aren't seeing any data for a given application, or the metrics look incorrect, see the article on troubleshooting test coverage.
Use the following metrics to understand your level of existing coverage for a page:
| Metric | Description |
|---|---|
| Performance | Average speed index in seconds to load this page in recent test runs. |
| Tests | Number of unique tests that have visited this particular page. If a test is part of multiple plans and runs against that page multiple times, only the first unique run is counted in the page coverage dashboard. |
| Steps | The number of distinct interaction steps from tests that visit this page in the selected time frame. Mabl distinguishes steps by the element they interact with and the action they perform. This total does not include steps that do not interact with the page, such as assertions, echo steps, or wait steps. |
| Assertions | The number of distinct assertion steps from tests that visit this page in the selected time frame. |
| Complexity | The overall complexity of the DOM itself as measured by mabl when crawling the page or during a regular test run. The higher the number, the more interactive elements the page contains, such as buttons, links, and fields. |
| Linked | The number of pages that link directly to this path as detected by the link crawler. The deeper a specific page is within your app, the lower this value will likely be. |
| Depth | The number of clicks necessary to access the specific path as recorded by the link crawler. For example, your app homepage has a depth of 0, while your login page likely has a depth of 1. |
| Daily users | The average daily unique users that visit the specific page. This metric uses data captured from the Segment integration. |
Filtering data
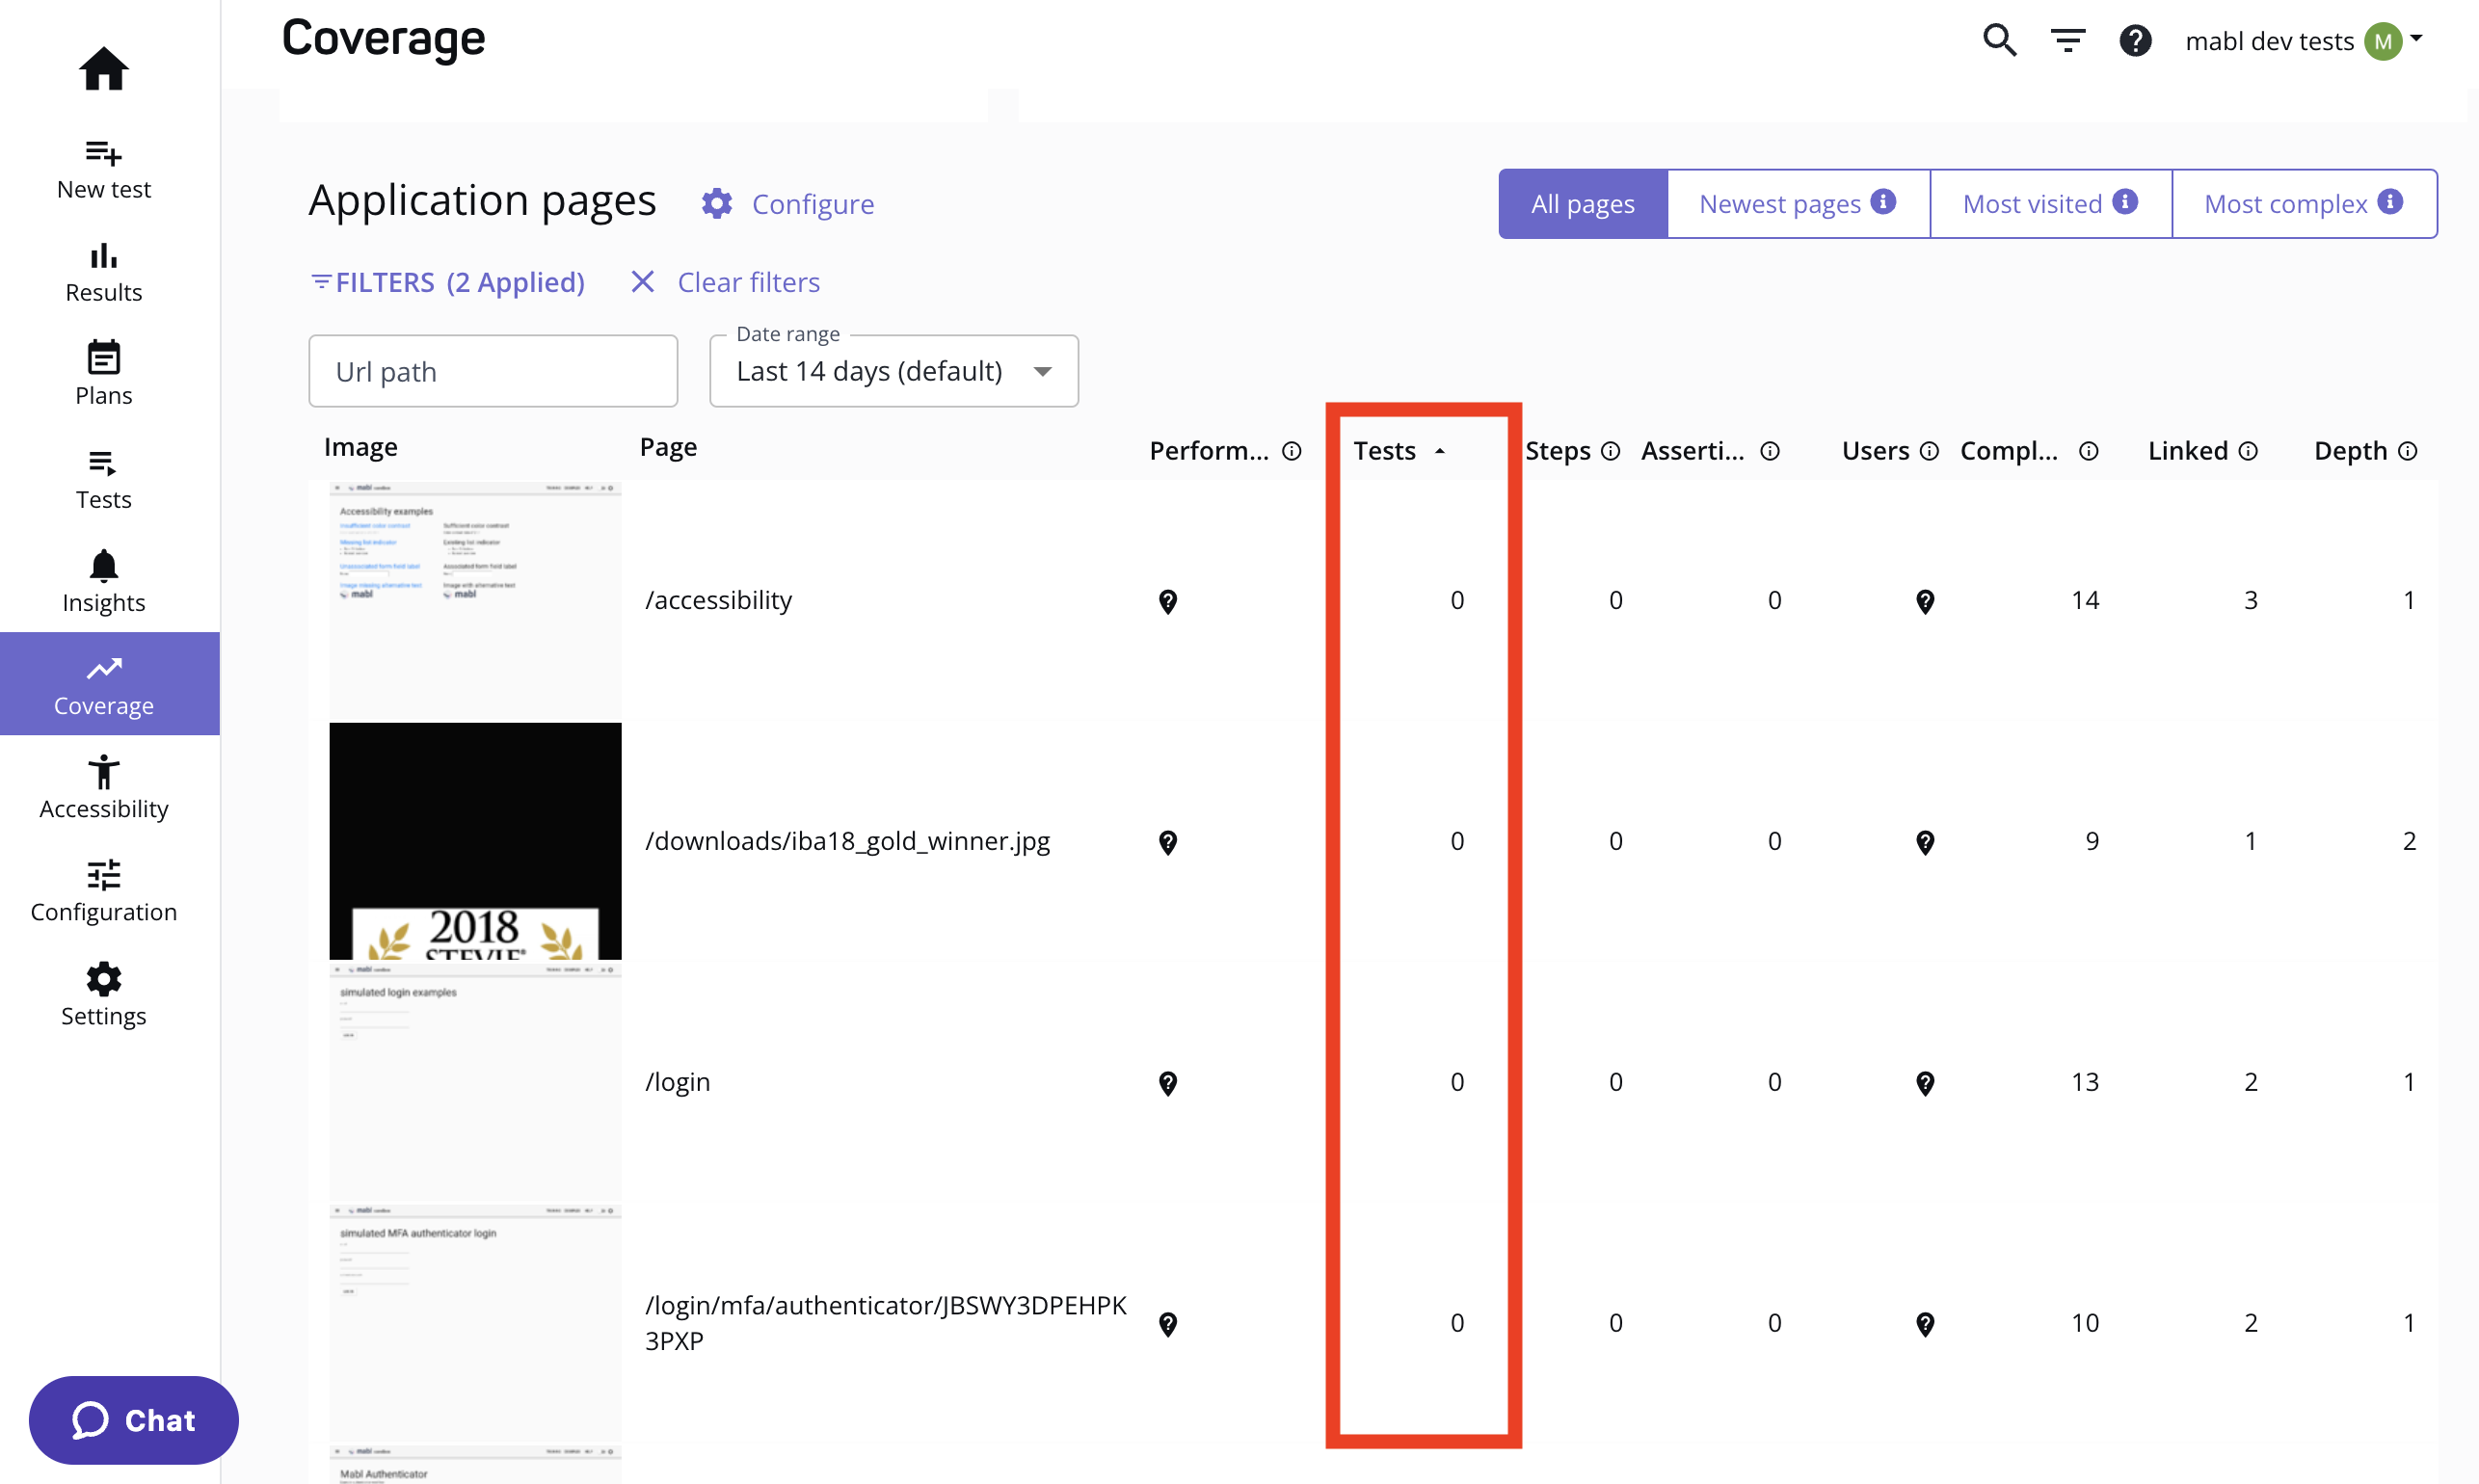
Identify pages that lack test coverage
To identify pages that lack test coverage, click on the Tests column to sort in ascending order. If the number of tests for a page is 0, it means that no tests visit this page besides the link crawler.
Click on the Steps column to identify pages that are lacking in steps that interact with the page.
Click on the Assertions column to identify pages that lack assertions that verify the state of the page.
Finding tests that lack coverage
Assess test coverage of heavily linked pages
To identify tests that are frequently linked in your application, click on the Linked column twice to sort in descending order. Pages that are heavily linked but lack test coverage could indicate a gap in your testing.
Find high-traffic pages that are lacking coverage
If you integrate your mabl workspace with Segment, you can identify high-traffic pages that lack coverage. When you connect mabl to a Segment source, mabl adds another metric to your page coverage dashboard: users. The Users column represents the number of unique users interacting with each page.
Click on the Users column twice to sort pages by unique daily users in descending order. A page that has a high number of daily users but a relatively low number of tests could indicate a gap in your testing coverage.
Updated over 1 year ago